|
Efficacy |
  
|
|
Efficacy |
|
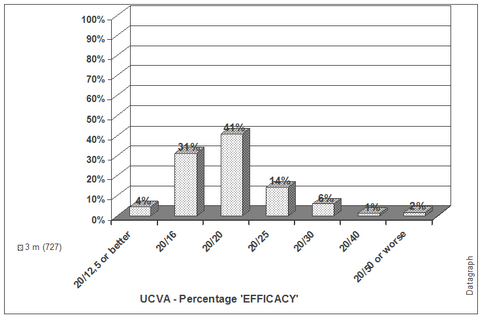
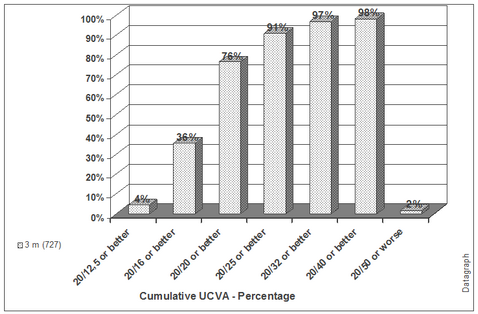
The distribution of post operative uncorrected visual acuity. It shows the percentage of patient reaching a certain level of unaided visual acuity. It is one of the most important parameters for patient happiness after the surgery.
Note that under 'distant visual acuity' we offer a slightly modified graph called 'cumulative UCVA' which may be better represents the postOP UCVA distribution than the classical Efficacy graph. It is the same data, just adding up the percentage of each UCVA group from left to right.