|
Safety |
  
|
|
Safety |
|
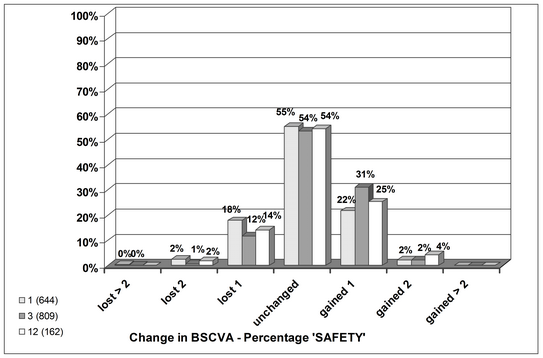
This graph shows the percentage of gained and lost lines of Best Spectacle Corrected Visual Acuity (BSCVA) at certain follow up points. It is an indicator of the safety of a procedure. A change of 2 or more lines is considered clinically significant. The label to the right indicates the selected follow up month and the number of eyes per follow up. By default 1 and 3 month data is selected. You may select only one particular month or several postoperative stages. (use 'ctrl' key when clicking on the follow up month in the filter window)