|
Contrast Sensitivity |
  
|
|
Contrast Sensitivity |
|
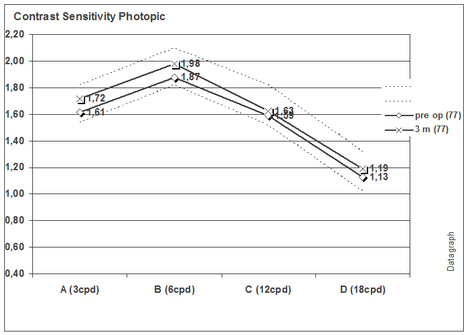
You may display graphs of the mean photopic and mesopic contrast sensitivity in a logMar scale base on measurements with the Vector Vision CSV 1000 (www.vectorvision.com). The dashed lines represent the normal range for photopic contrast sensitivity for a younger population between 20 and 50 years of age as given by vector vision inc.
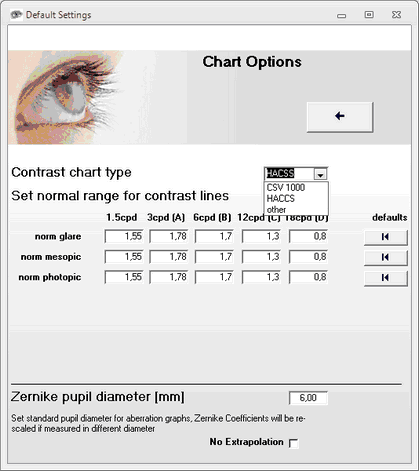
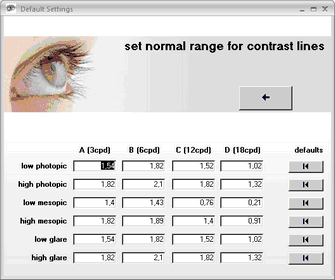
You can change the position of the dashed lines indicating the normal ranges under 'chart options' in the tools menu.
Starting from Version 4.07 Datagraph med supports the HACSS contrast sensitivity test. Defaults can be set under 'Chart Options'. If set to HACSS contrast graphs will have 5 frequencies starting from 1.5 cpd.